How EcoTuning Works
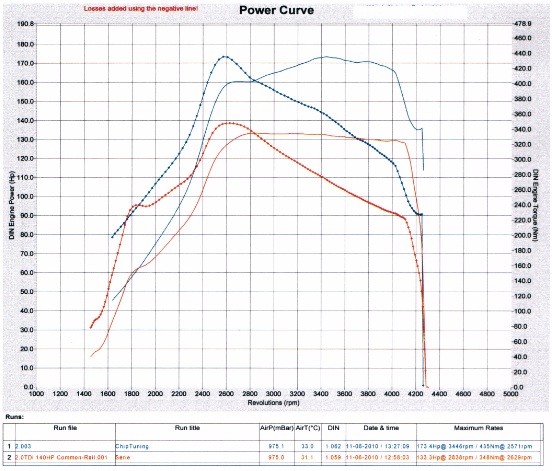
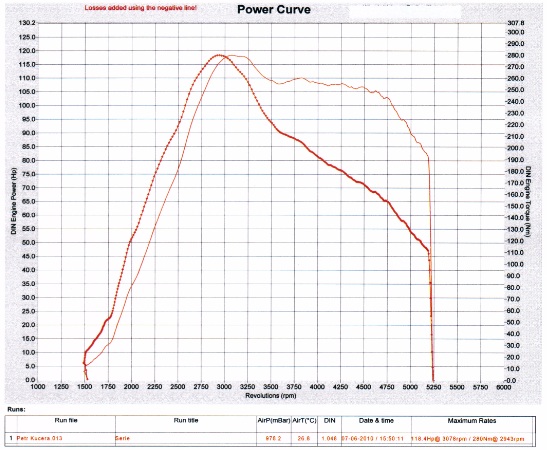
After power measurement, the customer receives a printed graph from the rolling road showing the power and torque curves (fig. 1). In the case of measurement before and after the modification, they receive a comparison graph with power and torque (fig. 2).
Example graph after engine power measurement (e.g. a competitor's modification, or a basis for a low-power warranty claim).
(In this case a 2.0 TDI SIEMENS PPD 140 HP with a faulty injector. Measured 118 HP instead of the standard 140 HP.)
Example comparison graph after engine power measurement before and after modification (chiptuning).
(In this case chiptuning of a VW Passat 2.0 TDi 140 HP Common-Rail.)